Readings & trends
See device temperature data in an accessible graphical view and review recorded conditions.

THERMOCLOUD
From sensor data to operational clarity.
Use graphs, notifications and downloadable reports to understand conditions and manage multiple devices from a shared platform.
Arrange a platform walkthrough ↗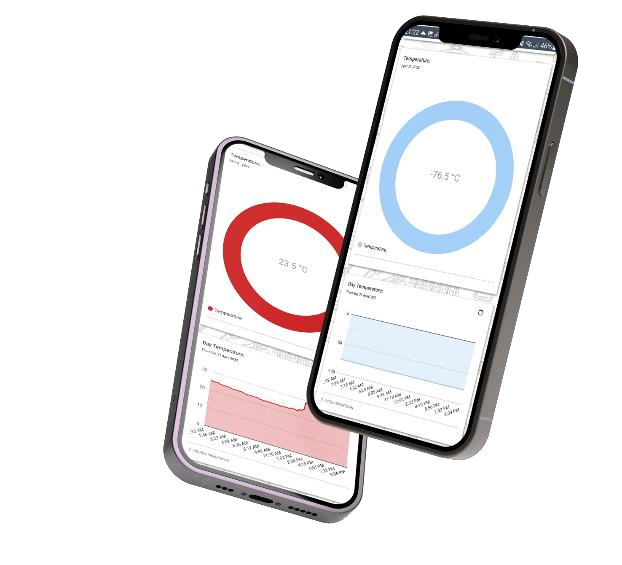
THE MANAGEMENT LAYER
See device temperature data in an accessible graphical view and review recorded conditions.
Configure notifications and temperature limits around the requirements of your operation.
Manage multiple devices with a multi-user dashboard and different user access roles.
A SIMPLE WORKFLOW
The supplied material describes QR-code device onboarding through the Thermologix app.
UNDERSTANDING “REAL TIME”
NanoTag’s standard sampling interval is ten minutes. Reading availability and notification delivery depend on device reporting, LoRaWAN coverage and platform connectivity. Discuss the update frequency your application needs.
HOW THE SYSTEM WORKS
NanoTag sends temperature readings through LoRaWAN gateways to the Thermologix backend. The platform turns those readings into graphs, events, reports and app notifications.
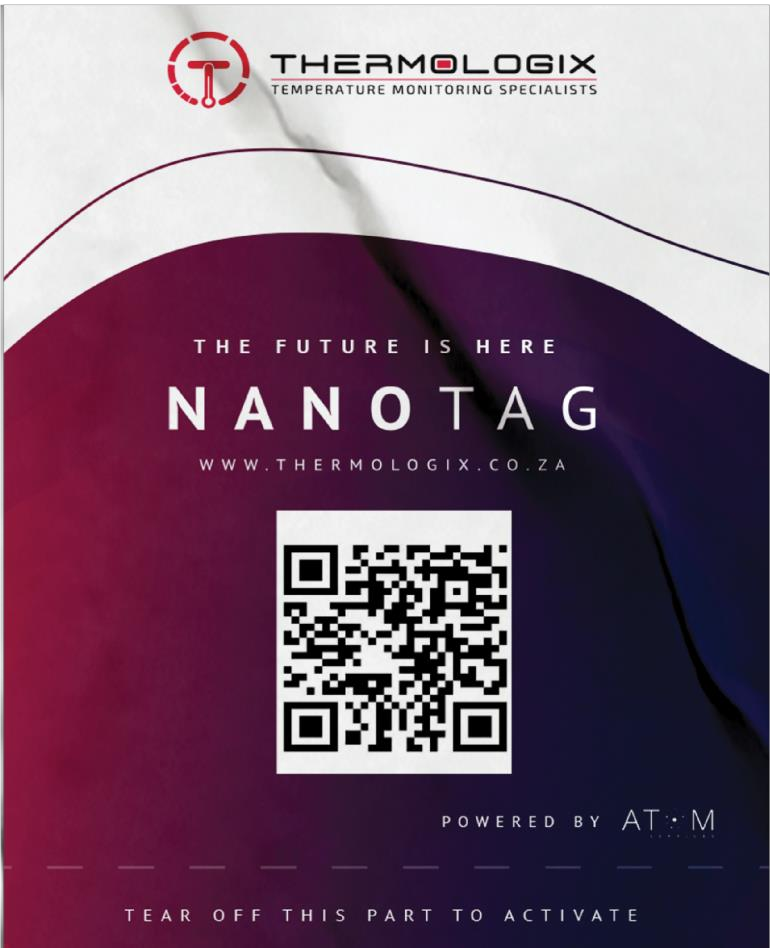
Install near the point you need to measure. Activate using the tear-off strip. The sensor takes readings at the configured interval.
Nearby gateways receive sensor transmissions. Coverage must be assessed for each site or route; the brochure describes network expansion where there is sufficient demand.
In a standard LoRaWAN deployment, a network server handles gateway traffic before data reaches the application backend. Thermologix’s brochure identifies its backend as the layer that interprets data and creates events, alerts and reports.
Manage devices, review temperature data and receive push notifications about possible excursions. Your team decides how to respond using its operating procedures.
Scanning adds the device to the app. Temperature telemetry travels via LoRaWAN, rather than through the QR code or a continuous phone connection.
The brochures describe backup memory, with a 2,000-sample rolling buffer in the detailed sheet. Confirm how stored readings are retrieved after an outage; automatic backfill is not specified.
The backend generates events and sends app notifications. Fresh readings and alerts depend on device reporting, network coverage and platform availability.
IN THE HANDS OF YOUR TEAM
Bring temperature data into the daily rhythm of your operation. Give the people responsible for your goods a clear view of conditions and notifications they can act on.
Arrange a walkthrough ↗
YOUR NEXT STEP
Tell us what you monitor. We’ll help you plan the right deployment.